
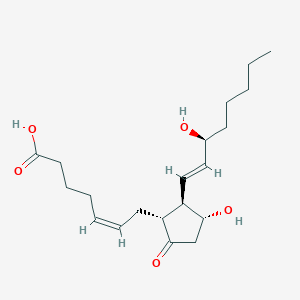
Details of Metabolite
| Full List of Protein(s) Regulated by This Metabolite | ||||||
|---|---|---|---|---|---|---|
| Voltage-gated ion channel (VIC) | ||||||
| Cation channel sperm-associated 1 (CatSper1) | Click to Show/Hide the Full List of Regulating Pair(s): 1 Pair(s) | |||||
| Detailed Information |
Protein Info
 click to show the details of this protein click to show the details of this protein
|
|||||
| Regulating Pair |
Experim Info
click to show the details of experiment for validating this pair
|
[1] | ||||
| Introduced Variation | Prostaglandin E2 addition (6 hours) | |||||
| Induced Change | CATSPER1 protein activity levels: increase | |||||
| Summary | Introduced Variation
|
|||||
| Disease Status | Healthy individual | |||||
| Details | It is reported that prostaglandin E2 addition causes the increase of CATSPER1 protein activity compared with control group. | |||||
| Cation channel sperm-associated 2 (CatSper2) | Click to Show/Hide the Full List of Regulating Pair(s): 1 Pair(s) | |||||
| Detailed Information |
Protein Info
click to show the details of this protein
|
|||||
| Regulating Pair |
Experim Info
click to show the details of experiment for validating this pair
|
[1] | ||||
| Introduced Variation | Prostaglandin E2 addition (6 hours) | |||||
| Induced Change | CATSPER2 protein activity levels: increase | |||||
| Summary | Introduced Variation
|
|||||
| Disease Status | Healthy individual | |||||
| Details | It is reported that prostaglandin E2 addition causes the increase of CATSPER2 protein activity compared with control group. | |||||
| Cation channel sperm-associated 3 (CatSper3) | Click to Show/Hide the Full List of Regulating Pair(s): 1 Pair(s) | |||||
| Detailed Information |
Protein Info
click to show the details of this protein
|
|||||
| Regulating Pair |
Experim Info
click to show the details of experiment for validating this pair
|
[1] | ||||
| Introduced Variation | Prostaglandin E2 addition (6 hours) | |||||
| Induced Change | CATSPER3 protein activity levels: increase | |||||
| Summary | Introduced Variation
|
|||||
| Disease Status | Healthy individual | |||||
| Details | It is reported that prostaglandin E2 addition causes the increase of CATSPER3 protein activity compared with control group. | |||||
| Cation channel sperm-associated 4 (CATSPER4) | Click to Show/Hide the Full List of Regulating Pair(s): 1 Pair(s) | |||||
| Detailed Information |
Protein Info
click to show the details of this protein
|
|||||
| Regulating Pair |
Experim Info
click to show the details of experiment for validating this pair
|
[1] | ||||
| Introduced Variation | Prostaglandin E2 addition (6 hours) | |||||
| Induced Change | CATSPER4 protein activity levels: increase | |||||
| Summary | Introduced Variation
|
|||||
| Disease Status | Healthy individual | |||||
| Details | It is reported that prostaglandin E2 addition causes the increase of CATSPER4 protein activity compared with control group. | |||||
| Full List of Protein(s) Regulating This Metabolite | ||||||
|---|---|---|---|---|---|---|
| Hydrolases (EC 3) | ||||||
| Group 10 secretory phospholipase A2 (PLA2G10) | Click to Show/Hide the Full List of Regulating Pair(s): 2 Pair(s) | |||||
| Detailed Information |
Protein Info
click to show the details of this protein
|
|||||
| Regulating Pair (1) |
Experim Info
click to show the details of experiment for validating this pair
|
[2] | ||||
| Introduced Variation | Overexpression of Pla2g10 | |||||
| Induced Change | Prostaglandin E2 concentration: increase | |||||
| Summary | Introduced Variation
|
|||||
| Disease Status | Inflammatory bowel disease [ICD-11: DD72] | |||||
| Details | It is reported that overexpression of Pla2g10 leads to the increase of prostaglandin E2 levels compared with control group. | |||||
| Regulating Pair (2) |
Experim Info
click to show the details of experiment for validating this pair
|
[3] | ||||
| Introduced Variation | Knockout of Pla2g10 | |||||
| Induced Change | Prostaglandin E2 concentration: decrease | |||||
| Summary | Introduced Variation
|
|||||
| Disease Status | Acute asthma exacerbations [ICD-11: CA23] | |||||
| Details | It is reported that knockout of Pla2g10 leads to the decrease of prostaglandin E2 levels compared with control group. | |||||
| Group 3 secretory phospholipase A2 (PLA2G3) | Click to Show/Hide the Full List of Regulating Pair(s): 1 Pair(s) | |||||
| Detailed Information |
Protein Info
click to show the details of this protein
|
|||||
| Regulating Pair |
Experim Info
click to show the details of experiment for validating this pair
|
[4] | ||||
| Introduced Variation | Knockout of Pla2g3 | |||||
| Induced Change | Prostaglandin E2 concentration: increase | |||||
| Summary | Introduced Variation
|
|||||
| Disease Status | Colorectal cancer [ICD-11: 2B91] | |||||
| Details | It is reported that knockout of Pla2g3 leads to the increase of prostaglandin E2 levels compared with control group. | |||||
| Monoacylglycerol lipase ABHD6 (ABHD6) | Click to Show/Hide the Full List of Regulating Pair(s): 1 Pair(s) | |||||
| Detailed Information |
Protein Info
click to show the details of this protein
|
|||||
| Regulating Pair |
Experim Info
click to show the details of experiment for validating this pair
|
[5] | ||||
| Introduced Variation | Inhibition (WWL70) of Abhd6 | |||||
| Induced Change | Prostaglandin E2 concentration: decrease | |||||
| Summary | Introduced Variation
|
|||||
| Disease Status | Healthy individual | |||||
| Details | It is reported that inhibition of Abhd6 leads to the decrease of prostaglandin E2 levels compared with control group. | |||||
| Sulfatase sulf-1 (SULF1) | Click to Show/Hide the Full List of Regulating Pair(s): 1 Pair(s) | |||||
| Detailed Information |
Protein Info
click to show the details of this protein
|
|||||
| Regulating Pair |
Experim Info
click to show the details of experiment for validating this pair
|
[6] | ||||
| Introduced Variation | Knockdown (shRNA) of SULF1 | |||||
| Induced Change | Prostaglandin E2 concentration: decrease (FC = 0.19 / 0.19) | |||||
| Summary | Introduced Variation
|
|||||
| Disease Status | Ovarian cancer [ICD-11: 2C73] | |||||
| Details | It is reported that knockdown of SULF1 leads to the decrease of prostaglandin E2 levels compared with control group. | |||||
| Organo anion transporter (OAT) | ||||||
| Organic anion transporter D (SLCO3A1) | Click to Show/Hide the Full List of Regulating Pair(s): 1 Pair(s) | |||||
| Detailed Information |
Protein Info
click to show the details of this protein
|
|||||
| Regulating Pair |
Experim Info
click to show the details of experiment for validating this pair
|
[7] | ||||
| Introduced Variation | Overexpression of SLCO3A1 | |||||
| Induced Change | Prostaglandin E2 concentration: increase | |||||
| Summary | Introduced Variation
|
|||||
| Disease Status | Healthy individual | |||||
| Details | It is reported that overexpression of SLCO3A1 leads to the increase of prostaglandin E2 levels compared with control group. | |||||
| Organic anion transporter E (SLCO4A1) | Click to Show/Hide the Full List of Regulating Pair(s): 1 Pair(s) | |||||
| Detailed Information |
Protein Info
click to show the details of this protein
|
|||||
| Regulating Pair |
Experim Info
click to show the details of experiment for validating this pair
|
[7] | ||||
| Introduced Variation | Overexpression of SLCO4A1 | |||||
| Induced Change | Prostaglandin E2 concentration: increase | |||||
| Summary | Introduced Variation
|
|||||
| Disease Status | Healthy individual | |||||
| Details | It is reported that overexpression of SLCO4A1 leads to the increase of prostaglandin E2 levels compared with control group. | |||||
| Solute carrier SLCO1B1 (OATP-C) | Click to Show/Hide the Full List of Regulating Pair(s): 1 Pair(s) | |||||
| Detailed Information |
Protein Info
click to show the details of this protein
|
|||||
| Regulating Pair |
Experim Info
click to show the details of experiment for validating this pair
|
[7] | ||||
| Introduced Variation | Overexpression of SLCO1B1 | |||||
| Induced Change | Prostaglandin E2 concentration: increase | |||||
| Summary | Introduced Variation
|
|||||
| Disease Status | Healthy individual | |||||
| Details | It is reported that overexpression of SLCO1B1 leads to the increase of prostaglandin E2 levels compared with control group. | |||||
| Solute carrier SLCO2B1 (OATPB) | Click to Show/Hide the Full List of Regulating Pair(s): 1 Pair(s) | |||||
| Detailed Information |
Protein Info
click to show the details of this protein
|
|||||
| Regulating Pair |
Experim Info
click to show the details of experiment for validating this pair
|
[7] | ||||
| Introduced Variation | Overexpression of SLCO2B1 | |||||
| Induced Change | Prostaglandin E2 concentration: increase | |||||
| Summary | Introduced Variation
|
|||||
| Disease Status | Healthy individual | |||||
| Details | It is reported that overexpression of SLCO2B1 leads to the increase of prostaglandin E2 levels compared with control group. | |||||
If you find any error in data or bug in web service, please kindly report it to Dr. Zhang and Dr. Mou.