
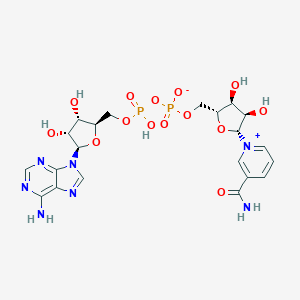
Details of Metabolite
| Full List of Protein(s) Regulating This Metabolite | ||||||
|---|---|---|---|---|---|---|
| Hydrolases (EC 3) | ||||||
| GTPase KRas (KRAS) | Click to Show/Hide the Full List of Regulating Pair(s): 1 Pair(s) | |||||
| Detailed Information |
Protein Info
 click to show the details of this protein click to show the details of this protein
|
|||||
| Regulating Pair |
Experim Info
click to show the details of experiment for validating this pair
|
[1] | ||||
| Introduced Variation | Overexpression of KRAS | |||||
| Induced Change | NAD concentration: decrease (FC = 0.52) | |||||
| Summary | Introduced Variation
|
|||||
| Disease Status | Lung cancer [ICD-11: 2C25] | |||||
| Details | It is reported that overexpression of KRAS leads to the decrease of NAD levels compared with control group. | |||||
| Kynureninase (KYNU) | Click to Show/Hide the Full List of Regulating Pair(s): 1 Pair(s) | |||||
| Detailed Information |
Protein Info
click to show the details of this protein
|
|||||
| Regulating Pair |
Experim Info
click to show the details of experiment for validating this pair
|
[2] | ||||
| Introduced Variation | Mutation (c.468T-A, c.1045_1051delTTTAAGC) of KYNU | |||||
| Induced Change | NAD concentration: decrease | |||||
| Summary | Introduced Variation
|
|||||
| Disease Status | Hereditary methemoglobinemia [ICD-11: 3A92] | |||||
| Details | It is reported that mutation (c.468T-A, c.1045_1051delTTTAAGC) of KYNU leads to the decrease of NAD levels compared with control group. | |||||
| Leukotriene-C4 hydrolase (GGT1) | Click to Show/Hide the Full List of Regulating Pair(s): 1 Pair(s) | |||||
| Detailed Information |
Protein Info
click to show the details of this protein
|
|||||
| Regulating Pair |
Experim Info
click to show the details of experiment for validating this pair
|
[3] | ||||
| Introduced Variation | Knockdown (siRNA) of GGT1 | |||||
| Induced Change | NAD concentration: increase | |||||
| Summary | Introduced Variation
|
|||||
| Disease Status | Renal cell carcinoma [ICD-11: 2C90] | |||||
| Details | It is reported that knockdown of GGT1 leads to the increase of NAD levels compared with control group. | |||||
| Sulfatase sulf-1 (SULF1) | Click to Show/Hide the Full List of Regulating Pair(s): 1 Pair(s) | |||||
| Detailed Information |
Protein Info
click to show the details of this protein
|
|||||
| Regulating Pair |
Experim Info
click to show the details of experiment for validating this pair
|
[4] | ||||
| Introduced Variation | Knockdown (shRNA) of SULF1 | |||||
| Induced Change | NAD concentration: decrease (FC = 0.18 / 0.24) | |||||
| Summary | Introduced Variation
|
|||||
| Disease Status | Ovarian cancer [ICD-11: 2C73] | |||||
| Details | It is reported that knockdown of SULF1 leads to the decrease of NAD levels compared with control group. | |||||
| Mitochondrial carrier (MC) | ||||||
| Oxoglutarate/malate carrier protein (SLC25A11) | Click to Show/Hide the Full List of Regulating Pair(s): 2 Pair(s) | |||||
| Detailed Information |
Protein Info
click to show the details of this protein
|
|||||
| Regulating Pair (1) |
Experim Info
click to show the details of experiment for validating this pair
|
[5] | ||||
| Introduced Variation | Knockdown (siRNA) of SLC25A11 | |||||
| Induced Change | NAD concentration: decrease (FC = 0.60) | |||||
| Summary | Introduced Variation
|
|||||
| Disease Status | Melanoma [ICD-11: 2C30] | |||||
| Details | It is reported that knockdown of SLC25A11 leads to the decrease of NAD levels compared with control group. | |||||
| Regulating Pair (2) |
Experim Info
click to show the details of experiment for validating this pair
|
[5] | ||||
| Introduced Variation | Knockdown (shRNA) of SLC25A11 | |||||
| Induced Change | NAD concentration: decrease | |||||
| Summary | Introduced Variation
|
|||||
| Disease Status | Melanoma [ICD-11: 2C30] | |||||
| Details | It is reported that knockdown of SLC25A11 leads to the decrease of NAD levels compared with control group. | |||||
| Nitrogen permease regulator (NPR) | ||||||
| Natriuretic peptide receptor B (NPR2) | Click to Show/Hide the Full List of Regulating Pair(s): 1 Pair(s) | |||||
| Detailed Information |
Protein Info
click to show the details of this protein
|
|||||
| Regulating Pair |
Experim Info
click to show the details of experiment for validating this pair
|
[6] | ||||
| Introduced Variation | Deletion of NPR2 | |||||
| Induced Change | NAD concentration: increase | |||||
| Summary | Introduced Variation
|
|||||
| Disease Status | Healthy individual | |||||
| Details | It is reported that deletion of NPR2 leads to the increase of NAD levels compared with control group. | |||||
| Oxidoreductases (EC 1) | ||||||
| 3-hydroxyanthranilate oxygenase (HAAO) | Click to Show/Hide the Full List of Regulating Pair(s): 2 Pair(s) | |||||
| Detailed Information |
Protein Info
click to show the details of this protein
|
|||||
| Regulating Pair (1) |
Experim Info
click to show the details of experiment for validating this pair
|
[2] | ||||
| Introduced Variation | Mutation (c.558G-A) of HAAO | |||||
| Induced Change | NAD concentration: decrease | |||||
| Summary | Introduced Variation
|
|||||
| Disease Status | Hereditary methemoglobinemia [ICD-11: 3A92] | |||||
| Details | It is reported that mutation (c.558G-A) of HAAO leads to the decrease of NAD levels compared with control group. | |||||
| Regulating Pair (2) |
Experim Info
click to show the details of experiment for validating this pair
|
[2] | ||||
| Introduced Variation | Mutation (c.483dupT) of HAAO | |||||
| Induced Change | NAD concentration: decrease (FC= 0.33) | |||||
| Summary | Introduced Variation
|
|||||
| Disease Status | Hereditary methemoglobinemia [ICD-11: 3A92] | |||||
| Details | It is reported that mutation (c.483dupT) of HAAO leads to the decrease of NAD levels compared with control group. | |||||
| Pore-forming PNC peptide (PNC) | ||||||
| Cellular tumor antigen p53 (TP53) | Click to Show/Hide the Full List of Regulating Pair(s): 1 Pair(s) | |||||
| Detailed Information |
Protein Info
click to show the details of this protein
|
|||||
| Regulating Pair |
Experim Info
click to show the details of experiment for validating this pair
|
[7] | ||||
| Introduced Variation | Knockout of TP53 | |||||
| Induced Change | NAD concentration: increase (Log2 FC=1.37) | |||||
| Summary | Introduced Variation
|
|||||
| Disease Status | Colon cancer [ICD-11: 2B90] | |||||
| Details | It is reported that knockout of TP53 leads to the increase of NAD levels compared with control group. | |||||
| Transcription factor (TF) | ||||||
| Forkhead box protein O1 (FOXO1) | Click to Show/Hide the Full List of Regulating Pair(s): 1 Pair(s) | |||||
| Detailed Information |
Protein Info
click to show the details of this protein
|
|||||
| Regulating Pair |
Experim Info
click to show the details of experiment for validating this pair
|
[8] | ||||
| Introduced Variation | Overexpression of Foxo1 | |||||
| Induced Change | NAD concentration: decrease (FC = 0.80) | |||||
| Summary | Introduced Variation
|
|||||
| Disease Status | Healthy individual | |||||
| Details | It is reported that overexpression of Foxo1 leads to the decrease of NAD levels compared with control group. | |||||
| Transferases (EC 2) | ||||||
| Pyridoxal kinase (PDXK) | Click to Show/Hide the Full List of Regulating Pair(s): 1 Pair(s) | |||||
| Detailed Information |
Protein Info
click to show the details of this protein
|
|||||
| Regulating Pair |
Experim Info
click to show the details of experiment for validating this pair
|
[9] | ||||
| Introduced Variation | Knockout (CRISPR/Cas9 sgRNA) of PDXK | |||||
| Induced Change | NAD concentration: decrease | |||||
| Summary | Introduced Variation
|
|||||
| Disease Status | Acute myeloid leukaemia [ICD-11: 2A60] | |||||
| Details | It is reported that knockout of PDXK leads to the decrease of NAD levels compared with control group. | |||||
| Zinc finger protein (ZIN) | ||||||
| Protein snail homolog 1 (SNAI1) | Click to Show/Hide the Full List of Regulating Pair(s): 1 Pair(s) | |||||
| Detailed Information |
Protein Info
click to show the details of this protein
|
|||||
| Regulating Pair |
Experim Info
click to show the details of experiment for validating this pair
|
[10] | ||||
| Introduced Variation | Knockdown (shRNA) of SNAI1 | |||||
| Induced Change | NAD concentration: increase | |||||
| Summary | Introduced Variation
|
|||||
| Disease Status | Breast cancer [ICD-11: 2C60] | |||||
| Details | It is reported that knockdown of Snai1 leads to the increase of NAD levels compared with control group. | |||||
If you find any error in data or bug in web service, please kindly report it to Dr. Zhang and Dr. Mou.