
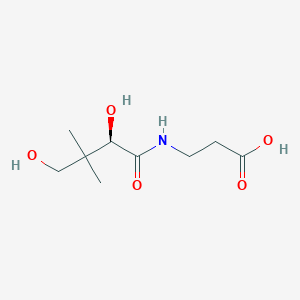
Details of Metabolite
| Full List of Protein(s) Regulating This Metabolite | ||||||
|---|---|---|---|---|---|---|
| GPCR secretin (GPCR-2) | ||||||
| Glucagon receptor (GCGR) | Click to Show/Hide the Full List of Regulating Pair(s): 1 Pair(s) | |||||
| Detailed Information |
Protein Info
 click to show the details of this protein click to show the details of this protein
|
|||||
| Regulating Pair |
Experim Info
click to show the details of experiment for validating this pair
|
[1] | ||||
| Introduced Variation | Knockout of Gcgr | |||||
| Induced Change | Pantothenic acid concentration: increase (FC = 1.7) | |||||
| Summary | Introduced Variation
|
|||||
| Disease Status | Type 2 diabetes mellitus [ICD-11: 5A11] | |||||
| Details | It is reported that knockout of GCGR leads to the increase of pantothenic acid levels compared with control group. | |||||
| Hydrolases (EC 3) | ||||||
| GTPase KRas (KRAS) | Click to Show/Hide the Full List of Regulating Pair(s): 1 Pair(s) | |||||
| Detailed Information |
Protein Info
click to show the details of this protein
|
|||||
| Regulating Pair |
Experim Info
click to show the details of experiment for validating this pair
|
[2] | ||||
| Introduced Variation | Overexpression of KRAS | |||||
| Induced Change | Pantothenic acid concentration: decrease (FC = 0.64) | |||||
| Summary | Introduced Variation
|
|||||
| Disease Status | Lung cancer [ICD-11: 2C25] | |||||
| Details | It is reported that overexpression of KRAS leads to the decrease of pantothenic acid levels compared with control group. | |||||
| Sulfatase sulf-1 (SULF1) | Click to Show/Hide the Full List of Regulating Pair(s): 1 Pair(s) | |||||
| Detailed Information |
Protein Info
click to show the details of this protein
|
|||||
| Regulating Pair |
Experim Info
click to show the details of experiment for validating this pair
|
[3] | ||||
| Introduced Variation | Knockdown (shRNA) of SULF1 | |||||
| Induced Change | Pantothenic acid concentration: decrease (FC = 0.37 / 0.43) | |||||
| Summary | Introduced Variation
|
|||||
| Disease Status | Ovarian cancer [ICD-11: 2C73] | |||||
| Details | It is reported that knockdown of SULF1 leads to the decrease of pantothenic acid levels compared with control group. | |||||
| Lyases (EC 4) | ||||||
| Selenocysteine lyase (SCLY) | Click to Show/Hide the Full List of Regulating Pair(s): 1 Pair(s) | |||||
| Detailed Information |
Protein Info
click to show the details of this protein
|
|||||
| Regulating Pair |
Experim Info
click to show the details of experiment for validating this pair
|
[4] | ||||
| Introduced Variation | Knockout of Scly | |||||
| Induced Change | Pantothenic acid concentration: decrease | |||||
| Summary | Introduced Variation
|
|||||
| Disease Status | Healthy individual | |||||
| Details | It is reported that knockout of Scly leads to the decrease of pantothenic acid levels compared with control group. | |||||
| Pore-forming PNC peptide (PNC) | ||||||
| Cellular tumor antigen p53 (TP53) | Click to Show/Hide the Full List of Regulating Pair(s): 1 Pair(s) | |||||
| Detailed Information |
Protein Info
click to show the details of this protein
|
|||||
| Regulating Pair |
Experim Info
click to show the details of experiment for validating this pair
|
[5] | ||||
| Introduced Variation | Knockout of TP53 | |||||
| Induced Change | Pantothenic acid concentration: decrease (Log2 FC=0.59) | |||||
| Summary | Introduced Variation
|
|||||
| Disease Status | Colon cancer [ICD-11: 2B90] | |||||
| Details | It is reported that knockout of TP53 leads to the decrease of pantothenic acid levels compared with control group. | |||||
| Transcription factor (TF) | ||||||
| Forkhead box protein O1 (FOXO1) | Click to Show/Hide the Full List of Regulating Pair(s): 1 Pair(s) | |||||
| Detailed Information |
Protein Info
click to show the details of this protein
|
|||||
| Regulating Pair |
Experim Info
click to show the details of experiment for validating this pair
|
[6] | ||||
| Introduced Variation | Overexpression of Foxo1 | |||||
| Induced Change | Pantothenic acid concentration: decrease (FC = 0.30) | |||||
| Summary | Introduced Variation
|
|||||
| Disease Status | Healthy individual | |||||
| Details | It is reported that overexpression of Foxo1 leads to the decrease of pantothenic acid levels compared with control group. | |||||
If you find any error in data or bug in web service, please kindly report it to Dr. Zhang and Dr. Mou.