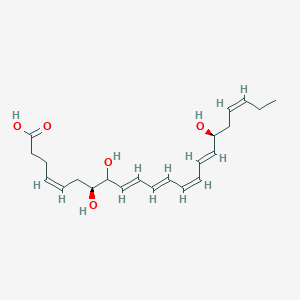
Details of Metabolite
| Full List of Protein(s) Regulated by This Metabolite | ||||||
|---|---|---|---|---|---|---|
| GPCR rhodopsin (GPCR-1) | ||||||
| FMLP-related receptor I (FPR2) | Click to Show/Hide the Full List of Regulating Pair(s): 2 Pair(s) | |||||
| Detailed Information |
Protein Info
 click to show the details of this protein click to show the details of this protein
|
|||||
| Regulating Pair (1) |
Experim Info
 click to show the details of experiment for validating this pair click to show the details of experiment for validating this pair
|
[1] | ||||
| Introduced Variation | Resolvin D1 addition (1 hours) | |||||
| Induced Change | FPR2 protein activity levels: increase | |||||
| Summary | Introduced Variation
|
|||||
| Disease Status | Peritonitis [ICD-11: DC50] | |||||
| Details | It is reported that resolvin D1 addition causes the increase of FPR2 protein activity compared with control group. | |||||
| Regulating Pair (2) |
Experim Info
 click to show the details of experiment for validating this pair click to show the details of experiment for validating this pair
|
[2] | ||||
| Introduced Variation | Resolvin D1 addition (1 hours) | |||||
| Induced Change | FPR2 protein affinity activity levels: increase | |||||
| Summary | Introduced Variation
|
|||||
| Disease Status | Peritonitis [ICD-11: DC50] | |||||
| Details | It is reported that resolvin D1 addition causes the increase of FPR2 protein affinity activity compared with control group. | |||||
| G-protein coupled receptor 32 (GPR32) | Click to Show/Hide the Full List of Regulating Pair(s): 1 Pair(s) | |||||
| Detailed Information |
Protein Info
 click to show the details of this protein click to show the details of this protein
|
|||||
| Regulating Pair |
Experim Info
 click to show the details of experiment for validating this pair click to show the details of experiment for validating this pair
|
[1] | ||||
| Introduced Variation | Resolvin D1 addition (1 hours) | |||||
| Induced Change | GPR32 protein activity levels: increase | |||||
| Summary | Introduced Variation
|
|||||
| Disease Status | Peritonitis [ICD-11: DC50] | |||||
| Details | It is reported that resolvin D1 addition causes the increase of GPR32 protein activity compared with control group. | |||||
| Interleukin (IL) | ||||||
| Interleukin-10 (IL10) | Click to Show/Hide the Full List of Regulating Pair(s): 1 Pair(s) | |||||
| Detailed Information |
Protein Info
 click to show the details of this protein click to show the details of this protein
|
|||||
| Regulating Pair |
Experim Info
 click to show the details of experiment for validating this pair click to show the details of experiment for validating this pair
|
[1] | ||||
| Introduced Variation | Resolvin D1 addition (72 hours) | |||||
| Induced Change | IL10 protein expression levels: increase | |||||
| Summary | Introduced Variation
|
|||||
| Disease Status | Peritonitis [ICD-11: DC50] | |||||
| Details | It is reported that resolvin D1 addition causes the increase of IL10 protein expression compared with control group. | |||||
| Full List of Protein(s) Regulating This Metabolite | ||||||
|---|---|---|---|---|---|---|
| Hydrolases (EC 3) | ||||||
| Group 3 secretory phospholipase A2 (PLA2G3) | Click to Show/Hide the Full List of Regulating Pair(s): 1 Pair(s) | |||||
| Detailed Information |
Protein Info
 click to show the details of this protein click to show the details of this protein
|
|||||
| Regulating Pair |
Experim Info
 click to show the details of experiment for validating this pair click to show the details of experiment for validating this pair
|
[3] | ||||
| Introduced Variation | Knockout of Pla2g3 | |||||
| Induced Change | Resolvin D1 concentration: increase | |||||
| Summary | Introduced Variation
|
|||||
| Disease Status | Colorectal cancer [ICD-11: 2B91] | |||||
| Details | It is reported that knockout of Pla2g3 leads to the increase of resolvin D1 levels compared with control group. | |||||
If you find any error in data or bug in web service, please kindly report it to Dr. Zhang and Dr. Mou.

