
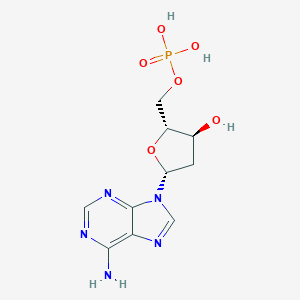
Details of Metabolite
| Full List of Protein(s) Regulating This Metabolite | ||||||
|---|---|---|---|---|---|---|
| Nitrogen permease regulator (NPR) | ||||||
| Natriuretic peptide receptor B (NPR2) | Click to Show/Hide the Full List of Regulating Pair(s): 1 Pair(s) | |||||
| Detailed Information |
Protein Info
 click to show the details of this protein click to show the details of this protein
|
|||||
| Regulating Pair |
Experim Info
click to show the details of experiment for validating this pair
|
[1] | ||||
| Introduced Variation | Deletion of NPR2 | |||||
| Induced Change | Deoxyadenosine monophosphate concentration: decrease | |||||
| Summary | Introduced Variation
|
|||||
| Disease Status | Healthy individual | |||||
| Details | It is reported that deletion of NPR2 leads to the decrease of deoxyadenosine monophosphate levels compared with control group. | |||||
| Pore-forming PNC peptide (PNC) | ||||||
| Cellular tumor antigen p53 (TP53) | Click to Show/Hide the Full List of Regulating Pair(s): 1 Pair(s) | |||||
| Detailed Information |
Protein Info
click to show the details of this protein
|
|||||
| Regulating Pair |
Experim Info
click to show the details of experiment for validating this pair
|
[2] | ||||
| Introduced Variation | Knockout of TP53 | |||||
| Induced Change | Deoxyadenosine monophosphate concentration: increase (Log2 FC=1.28) | |||||
| Summary | Introduced Variation
|
|||||
| Disease Status | Colon cancer [ICD-11: 2B90] | |||||
| Details | It is reported that knockout of TP53 leads to the increase of deoxyadenosine monophosphate levels compared with control group. | |||||
| Transcription factor (TF) | ||||||
| R2R3-MYB (AN2) | Click to Show/Hide the Full List of Regulating Pair(s): 1 Pair(s) | |||||
| Detailed Information |
Protein Info
click to show the details of this protein
|
|||||
| Regulating Pair |
Experim Info
click to show the details of experiment for validating this pair
|
[3] | ||||
| Introduced Variation | Overexpression of AN2 | |||||
| Induced Change | Deoxyadenosine monophosphate concentration: increase (FC = 2.66) | |||||
| Summary | Introduced Variation
|
|||||
| Disease Status | Healthy individual | |||||
| Details | It is reported that overexpression of AN2 leads to the increase of deoxyadenosine monophosphate levels compared with control group. | |||||
If you find any error in data or bug in web service, please kindly report it to Dr. Zhang and Dr. Mou.