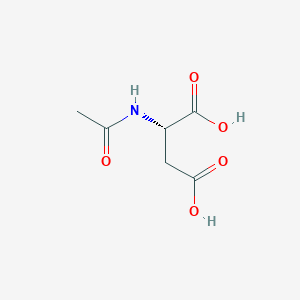
General Information of MET (ID: META00326)
Name N-Acetyl-L-aspartic acid
Synonyms   Click to Show/Hide Synonyms of This Metabolite
(2S)-2-Acetamidobutanedioate; (2S)-2-Acetamidobutanedioic acid; (S)-2-(Acetylamino)butanedioate; (S)-2-(Acetylamino)butanedioic acid; (S)-2-(Acetylamino)succinate; (S)-2-(Acetylamino)succinic acid; Acetyl aspartic acid; Acetyl-L-aspartate; Acetyl-L-aspartic acid; Acetylaspartate; Acetylaspartic acid; L-N-Acetylaspartate; L-N-Acetylaspartic acid; N-Acetyl aspartate; N-Acetyl-L-aspartate; N-Acetyl-S-aspartate; N-Acetyl-S-aspartic acid; N-Acetylaspartate; N-Acetylaspartate, monopotassium salt; N-Acetylaspartic acid; NAA
Source Endogenous;Escherichia Coli Metabolite;Food;Toxins/Pollutant;Microbial
Structure Type   Amino acids, peptides, and analogues  (Click to Show/Hide the Complete Structure Type Hierarchy)
Organic acids and derivatives
Carboxylic acids and derivatives
Amino acids, peptides, and analogues
PubChem CID
65065
HMDB ID
HMDB0000812
Formula
C6H9NO5
Structure
<iframe style="width: 300px; height: 300px;" frameborder="0" src="https://embed.molview.org/v1/?mode=balls&cid=65065"></iframe>
3D MOL 2D MOL
  Click to Show/Hide the Molecular/Functional Data (External Links/Property/Function) of This Metabolite
KEGG ID
C01042
ChEBI ID
21547
FooDB ID
FDB022260
ChemSpider ID
58576
METLIN ID
5776
Physicochemical Properties Molecular Weight 175.14 Topological Polar Surface Area 104
XlogP -1.1 Complexity 212
Heavy Atom Count 12 Rotatable Bond Count 4
Hydrogen Bond Donor Count 3 Hydrogen Bond Acceptor Count 5
Function
N-Acetylaspartic acid is a derivative of aspartic acid. It is the second most concentrated molecule in the brain after the amino acid glutamate. It is synthesized in neurons from the amino acid aspartate and acetyl coenzyme A (acetyl CoA). The various functions served by N-acetylaspartic acid are still under investigation, but the primary proposed functions include (1) acting as a neuronal osmolyte that is involved in fluid balance in the brain, (2) serving as a source of acetate for lipid and myelin synthesis in oligodendrocytes (the glial cells that myelinate neuronal axons), (3) serving as a precursor for the synthesis of the important dipeptide neurotransmitter N-acetylaspartylglutamate (NAAG), and (4) playing a potential role in energy production from the amino acid glutamate in neuronal mitochondria. High neurotransmitter levels can lead to abnormal neural signaling, delayed or arrested intellectual development, and difficulties with general motor skills. When present in sufficiently high levels, N-acetylaspartic acid can be a neurotoxin, an acidogen, and a metabotoxin. A neurotoxin is a compound that disrupts or attacks neural tissue. An acidogen is an acidic compound that induces acidosis, which has multiple adverse effects on many organ systems. A metabotoxin is an endogenously produced metabolite that causes adverse health effects at chronically high levels. Chronically high levels of N-acetylaspartic acid are associated with Canavan disease. N-acetylaspartic acid is an organic acid. Abnormally high levels of organic acids in the blood (organic acidemia), urine (organic aciduria), the brain, and other tissues lead to general metabolic acidosis. Acidosis typically occurs when arterial pH falls below 7.35. Infants with acidosis have symptoms that include poor feeding, vomiting, loss of appetite, weak muscle tone (hypotonia), and lack of energy (lethargy). These can progress to heart abnormalities, seizures, coma, and possibly death. Many affected children with organic acidemias experience intellectual disability or delayed development. In adults, acidosis or acidemia is characterized by headaches, confusion, feeling tired, tremors, sleepiness, and flapping tremors.
Regulatory Network
Full List of Protein(s) Regulating This Metabolite
      Divalent anion:Na symporter (DASS)
            Solute carrier family 13 member 3 (SLC13A3) Click to Show/Hide the Full List of Regulating Pair(s):   2 Pair(s)
               Detailed Information Protein   Info click to show the details of this protein
               Regulating Pair (1) Experim Info click to show the details of experiment for validating this pair [1]
                      Introduced Variation Mutation (Ala254Asp) of SLC13A3
                      Induced Change N-Acetyl-L-aspartic acid concentration: decrease
                      Summary Introduced Variation         Induced Change 
                      Disease Status Healthy individual
                      Details It is reported that mutation (Ala254Asp) of SLC13A3 leads to the decrease of N-acetyl-L-aspartic acid levels compared with control group.
               Regulating Pair (2) Experim Info click to show the details of experiment for validating this pair [1]
                      Introduced Variation Mutation (Gly548Ser) of SLC13A3
                      Induced Change N-Acetyl-L-aspartic acid concentration: decrease
                      Summary Introduced Variation         Induced Change 
                      Disease Status Healthy individual
                      Details It is reported that mutation (Gly548Ser) of SLC13A3 leads to the decrease of N-acetyl-L-aspartic acid levels compared with control group.
      Hydrolases (EC 3)
            GTPase KRas (KRAS) Click to Show/Hide the Full List of Regulating Pair(s):   2 Pair(s)
               Detailed Information Protein   Info click to show the details of this protein
               Regulating Pair (1) Experim Info click to show the details of experiment for validating this pair [2]
                      Introduced Variation Overexpression of KRAS
                      Induced Change N-Acetyl-L-aspartic acid concentration: decrease (FC = 0.37)
                      Summary Introduced Variation         Induced Change 
                      Disease Status Lung cancer [ICD-11: 2C25]
                      Details It is reported that overexpression of KRAS leads to the decrease of N-acetyl-L-aspartic acid levels compared with control group.
               Regulating Pair (2) Experim Info click to show the details of experiment for validating this pair [2]
                      Introduced Variation Overexpression of KRAS
                      Induced Change N-Acetyl-L-aspartic acid concentration: increase (FC = 1.68)
                      Summary Introduced Variation         Induced Change 
                      Disease Status Lung cancer [ICD-11: 2C25]
                      Details It is reported that overexpression of KRAS leads to the increase of N-acetyl-L-aspartic acid levels compared with control group.
            Sulfatase sulf-1 (SULF1) Click to Show/Hide the Full List of Regulating Pair(s):   1 Pair(s)
               Detailed Information Protein   Info click to show the details of this protein
               Regulating Pair Experim Info click to show the details of experiment for validating this pair [3]
                      Introduced Variation Knockdown (shRNA) of SULF1
                      Induced Change N-Acetyl-L-aspartic acid concentration: decrease (FC = 0.32 / 0.37)
                      Summary Introduced Variation         Induced Change 
                      Disease Status Ovarian cancer [ICD-11: 2C73]
                      Details It is reported that knockdown of SULF1 leads to the decrease of N-acetyl-L-aspartic acid levels compared with control group.
      Pore-forming PNC peptide (PNC)
            Cellular tumor antigen p53 (TP53) Click to Show/Hide the Full List of Regulating Pair(s):   1 Pair(s)
               Detailed Information Protein   Info click to show the details of this protein
               Regulating Pair Experim Info click to show the details of experiment for validating this pair [4]
                      Introduced Variation Knockout of TP53
                      Induced Change N-Acetyl-L-aspartic acid concentration: decrease (Log2 FC=0.72)
                      Summary Introduced Variation         Induced Change 
                      Disease Status Colon cancer [ICD-11: 2B90]
                      Details It is reported that knockout of TP53 leads to the decrease of N-acetyl-L-aspartic acid levels compared with control group.
References
1 SLC13A3 variants cause acute reversible leukoencephalopathy and -ketoglutarate accumulation. Ann Neurol. 2019 Mar;85(3):385-395.
2 Capturing the metabolomic diversity of KRAS mutants in non-small-cell lung cancer cells. Oncotarget. 2014 Jul 15;5(13):4722-31.
3 Erratum to: Loss of HSulf-1 promotes altered lipid metabolism in ovarian cancer. Cancer Metab. 2014 Nov 4;2:24.
4 Integrative omics analysis of p53-dependent regulation of metabolism. FEBS Lett. 2018 Feb;592(3):380-393.

If you find any error in data or bug in web service, please kindly report it to Dr. Zhang and Dr. Mou.