
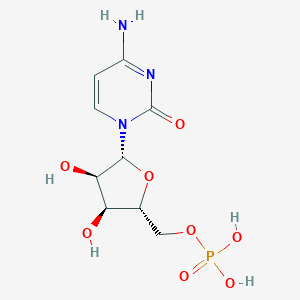
Details of Metabolite
| Full List of Protein(s) Regulating This Metabolite | ||||||
|---|---|---|---|---|---|---|
| Hydrolases (EC 3) | ||||||
| Sulfatase sulf-1 (SULF1) | Click to Show/Hide the Full List of Regulating Pair(s): 1 Pair(s) | |||||
| Detailed Information |
Protein Info
 click to show the details of this protein click to show the details of this protein
|
|||||
| Regulating Pair |
Experim Info
click to show the details of experiment for validating this pair
|
[1] | ||||
| Introduced Variation | Knockdown (shRNA) of SULF1 | |||||
| Induced Change | Cytidine monophosphate concentration: decrease (FC = 0.62 / 0.76) | |||||
| Summary | Introduced Variation
|
|||||
| Disease Status | Ovarian cancer [ICD-11: 2C73] | |||||
| Details | It is reported that knockdown of SULF1 leads to the decrease of cytidine monophosphate levels compared with control group. | |||||
| Mitochondrial carrier (MC) | ||||||
| Solute carrier family 25 member 36 (SLC25A36) | Click to Show/Hide the Full List of Regulating Pair(s): 1 Pair(s) | |||||
| Detailed Information |
Protein Info
click to show the details of this protein
|
|||||
| Regulating Pair |
Experim Info
click to show the details of experiment for validating this pair
|
[2] | ||||
| Introduced Variation | Recombinant protein addition of SLC25A36 | |||||
| Induced Change | Cytidine monophosphate concentration: increase | |||||
| Summary | Introduced Variation
|
|||||
| Disease Status | Healthy individual | |||||
| Details | It is reported that recombinant protein addition of SLC25A36 leads to the increase of cytidine monophosphate levels compared with control group. | |||||
| Nitrogen permease regulator (NPR) | ||||||
| Natriuretic peptide receptor B (NPR2) | Click to Show/Hide the Full List of Regulating Pair(s): 1 Pair(s) | |||||
| Detailed Information |
Protein Info
click to show the details of this protein
|
|||||
| Regulating Pair |
Experim Info
click to show the details of experiment for validating this pair
|
[3] | ||||
| Introduced Variation | Deletion of NPR2 | |||||
| Induced Change | Cytidine monophosphate concentration: decrease | |||||
| Summary | Introduced Variation
|
|||||
| Disease Status | Healthy individual | |||||
| Details | It is reported that deletion of NPR2 leads to the decrease of cytidine monophosphate levels compared with control group. | |||||
| Pore-forming PNC peptide (PNC) | ||||||
| Cellular tumor antigen p53 (TP53) | Click to Show/Hide the Full List of Regulating Pair(s): 1 Pair(s) | |||||
| Detailed Information |
Protein Info
click to show the details of this protein
|
|||||
| Regulating Pair |
Experim Info
click to show the details of experiment for validating this pair
|
[4] | ||||
| Introduced Variation | Knockout of TP53 | |||||
| Induced Change | Cytidine monophosphate concentration: decrease (Log2 FC=0.74) | |||||
| Summary | Introduced Variation
|
|||||
| Disease Status | Colon cancer [ICD-11: 2B90] | |||||
| Details | It is reported that knockout of TP53 leads to the decrease of cytidine monophosphate levels compared with control group. | |||||
| Sugar transporter (ST) | ||||||
| Facilitated glucose transporter 1 (SLC2A1A) | Click to Show/Hide the Full List of Regulating Pair(s): 1 Pair(s) | |||||
| Detailed Information |
Protein Info
click to show the details of this protein
|
|||||
| Regulating Pair |
Experim Info
click to show the details of experiment for validating this pair
|
[5] | ||||
| Introduced Variation | Downregulation of slc2a1a caused by Yap loss-of-function mutation | |||||
| Induced Change | Cytidine monophosphate concentration: increase | |||||
| Summary | Introduced Variation
|
|||||
| Disease Status | Healthy individual | |||||
| Details | It is reported that downregulation of slc2a1a caused by Yap loss-of-function mutation leads to the increase of cytidine monophosphate levels compared with control group. | |||||
| Transcriptional coactivator (TC) | ||||||
| Transcriptional coactivator YAP1 (yap1) | Click to Show/Hide the Full List of Regulating Pair(s): 1 Pair(s) | |||||
| Detailed Information |
Protein Info
click to show the details of this protein
|
|||||
| Regulating Pair |
Experim Info
click to show the details of experiment for validating this pair
|
[5] | ||||
| Introduced Variation | Decrease of Yap mRNA caused by Yap loss-of-function mutation | |||||
| Induced Change | Cytidine monophosphate concentration: increase | |||||
| Summary | Introduced Variation
|
|||||
| Disease Status | Healthy individual | |||||
| Details | It is reported that decrease of Yap mRNA caused by Yap loss-of-function mutation leads to the increase of cytidine monophosphate levels compared with control group. | |||||
If you find any error in data or bug in web service, please kindly report it to Dr. Zhang and Dr. Mou.