| Full List of Protein(s) Regulated by This Metabolite |
| GPCR rhodopsin (GPCR-1) |
|---|
| Hydroxycarboxylic acid receptor 3 (HCAR3) |
Click to Show/Hide the Full List of Regulating Pair(s): 1 Pair(s)
|
| Detailed Information |
Protein Info
 click to show the details of this protein click to show the details of this protein
|
| Regulating Pair |
Experim Info
click to show the details of experiment for validating this pair
|
[1] |
| Introduced Variation |
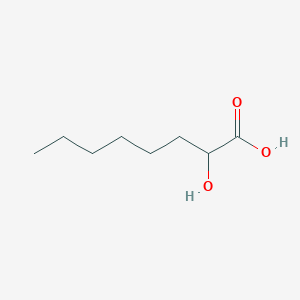
Hydroxyoctanoic acid addition (1 hours) |
| Induced Change |
HCAR3 protein activity levels: increase |
| Summary |
Introduced Variation

 Induced Change
|
| Disease Status |
Diabetic acidosis [ICD-11: 5A22]
|
| Details |
It is reported that hydroxyoctanoic acid addition causes the increase of HCAR3 protein activity compared with control group. |
| Transferases (EC 2) |
|---|
| Signal-regulated kinase 1 (ERK1) |
Click to Show/Hide the Full List of Regulating Pair(s): 1 Pair(s)
|
| Detailed Information |
Protein Info
click to show the details of this protein
|
| Regulating Pair |
Experim Info
click to show the details of experiment for validating this pair
|
[1] |
| Introduced Variation |
Hydroxyoctanoic acid addition (0.08 hours) |
| Induced Change |
MAPK3 protein phosphorylation levels: increase |
| Summary |
Introduced Variation
Induced Change
|
| Disease Status |
Diabetic acidosis [ICD-11: 5A22]
|
| Details |
It is reported that hydroxyoctanoic acid addition causes the increase of MAPK3 protein phosphorylation compared with control group. |
| Signal-regulated kinase 2 (ERK2) |
Click to Show/Hide the Full List of Regulating Pair(s): 1 Pair(s)
|
| Detailed Information |
Protein Info
click to show the details of this protein
|
| Regulating Pair |
Experim Info
click to show the details of experiment for validating this pair
|
[1] |
| Introduced Variation |
Hydroxyoctanoic acid addition (0.08 hours) |
| Induced Change |
MAPK1 protein phosphorylation levels: increase |
| Summary |
Introduced Variation
Induced Change
|
| Disease Status |
Diabetic acidosis [ICD-11: 5A22]
|
| Details |
It is reported that hydroxyoctanoic acid addition causes the increase of MAPK1 protein phosphorylation compared with control group. |
|
|
|
|
|
|
|